Economic Impact
Wisconsin taxpayers get a tremendous return on their investment in the state’s flagship university
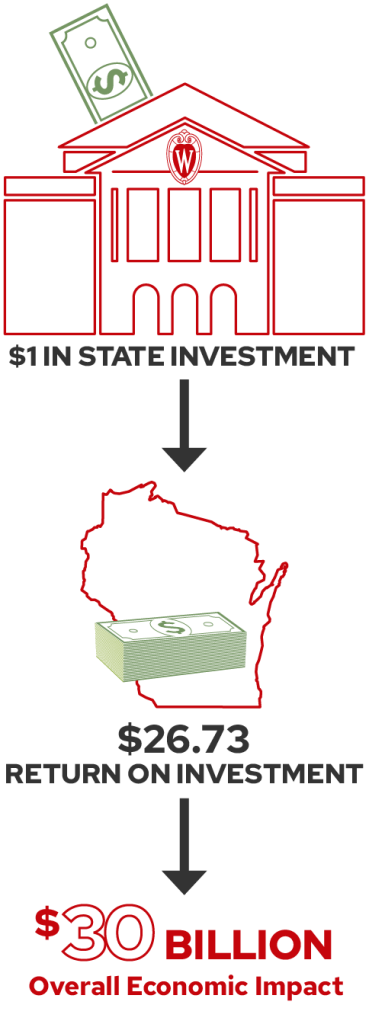
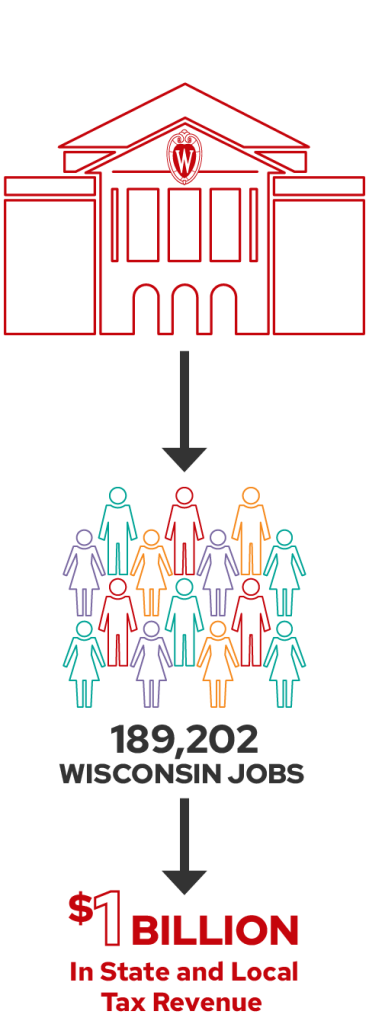

Revenue Sources in Fiscal Year 2022–2023
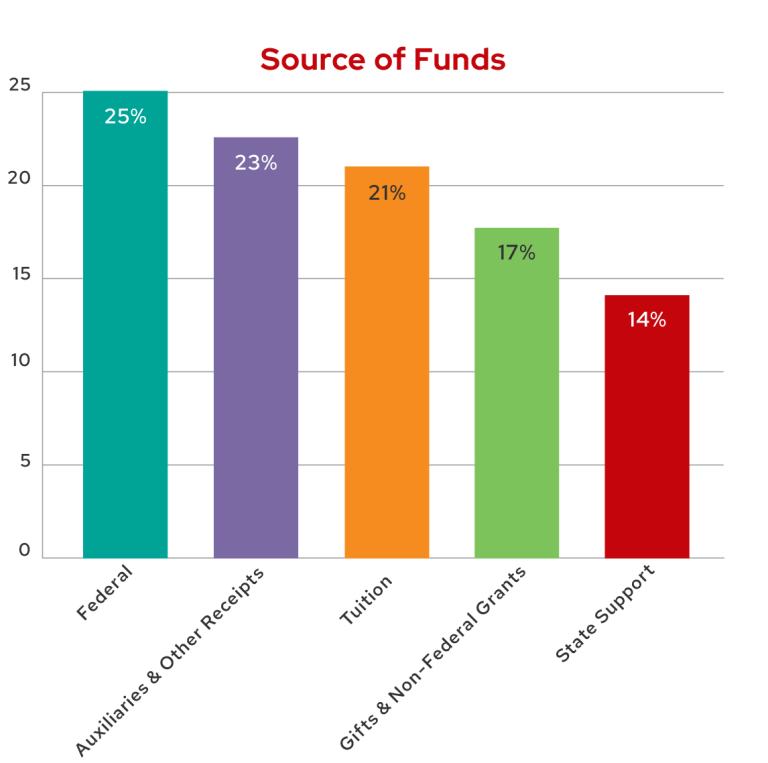
UW–Madison receives revenue from five main sources for its nearly $4 billion budget. The university’s mission is supported by state and federal government investments, tuition, research grants, and contributions from friends of the university.
Tuition & Required Fees
UW–Madison is consistently ranked one of the nation’s best values among public colleges and universities. The support of generations of Wisconsinites has helped to make UW–Madison a world-class institution. With continued support from state taxpayers, we strive for excellence while keeping tuition for in-state students affordable.
UW–Madison ranks 10th among the Big Ten Conference’s 13 public schools for in-state resident undergraduate tuition and fees. For nonresident undergraduate students, UW–Madison tuition and fees are third among Big Ten public universities.
| Undergraduate: Resident | Nonresident | |||
|---|---|---|---|---|
| University | Amount | Rank | Amount | Rank |
| Pennsylvania State University | $20,234 | 1 | $40,188 | 6 |
| University of Illinois at Urbana–Champaign | $17,572 | 2 | $36,068 | 9 |
| Rutgers University | $17,239 | 3 | $36,001 | 10 |
| University of Michigan | $17,228 | 4 | $58,072 | 1 |
| University of Minnesota–Twin Cities | $16,488 | 5 | $36,402 | 8 |
| Michigan State University | $16,051 | 6 | $43,435 | 2 |
| Ohio State University | $12,858 | 7 | $38,364 | 7 |
| Indiana University | $11,790 | 8 | $40,482 | 4 |
| University of Maryland | $11,505 | 9 | $40,306 | 5 |
| University of Wisconsin–Madison | $11,206 | 10 | $40,603 | 3 |
| University of Iowa | $10,964 | 11 | $32,927 | 11 |
| Purdue University | $9,992 | 12 | $28,794 | 12 |
| University of Nebraska | $9,939 | 13 | $27,689 | 13 |
| Average excluding UW–Madison | $14,322 | $38,227 | ||
| Midpoint excluding UW–Madison | $14,455 | $37,383 | ||
| University of Nebraska | -$3,249 | +$3,220 | ||
Source of Funds
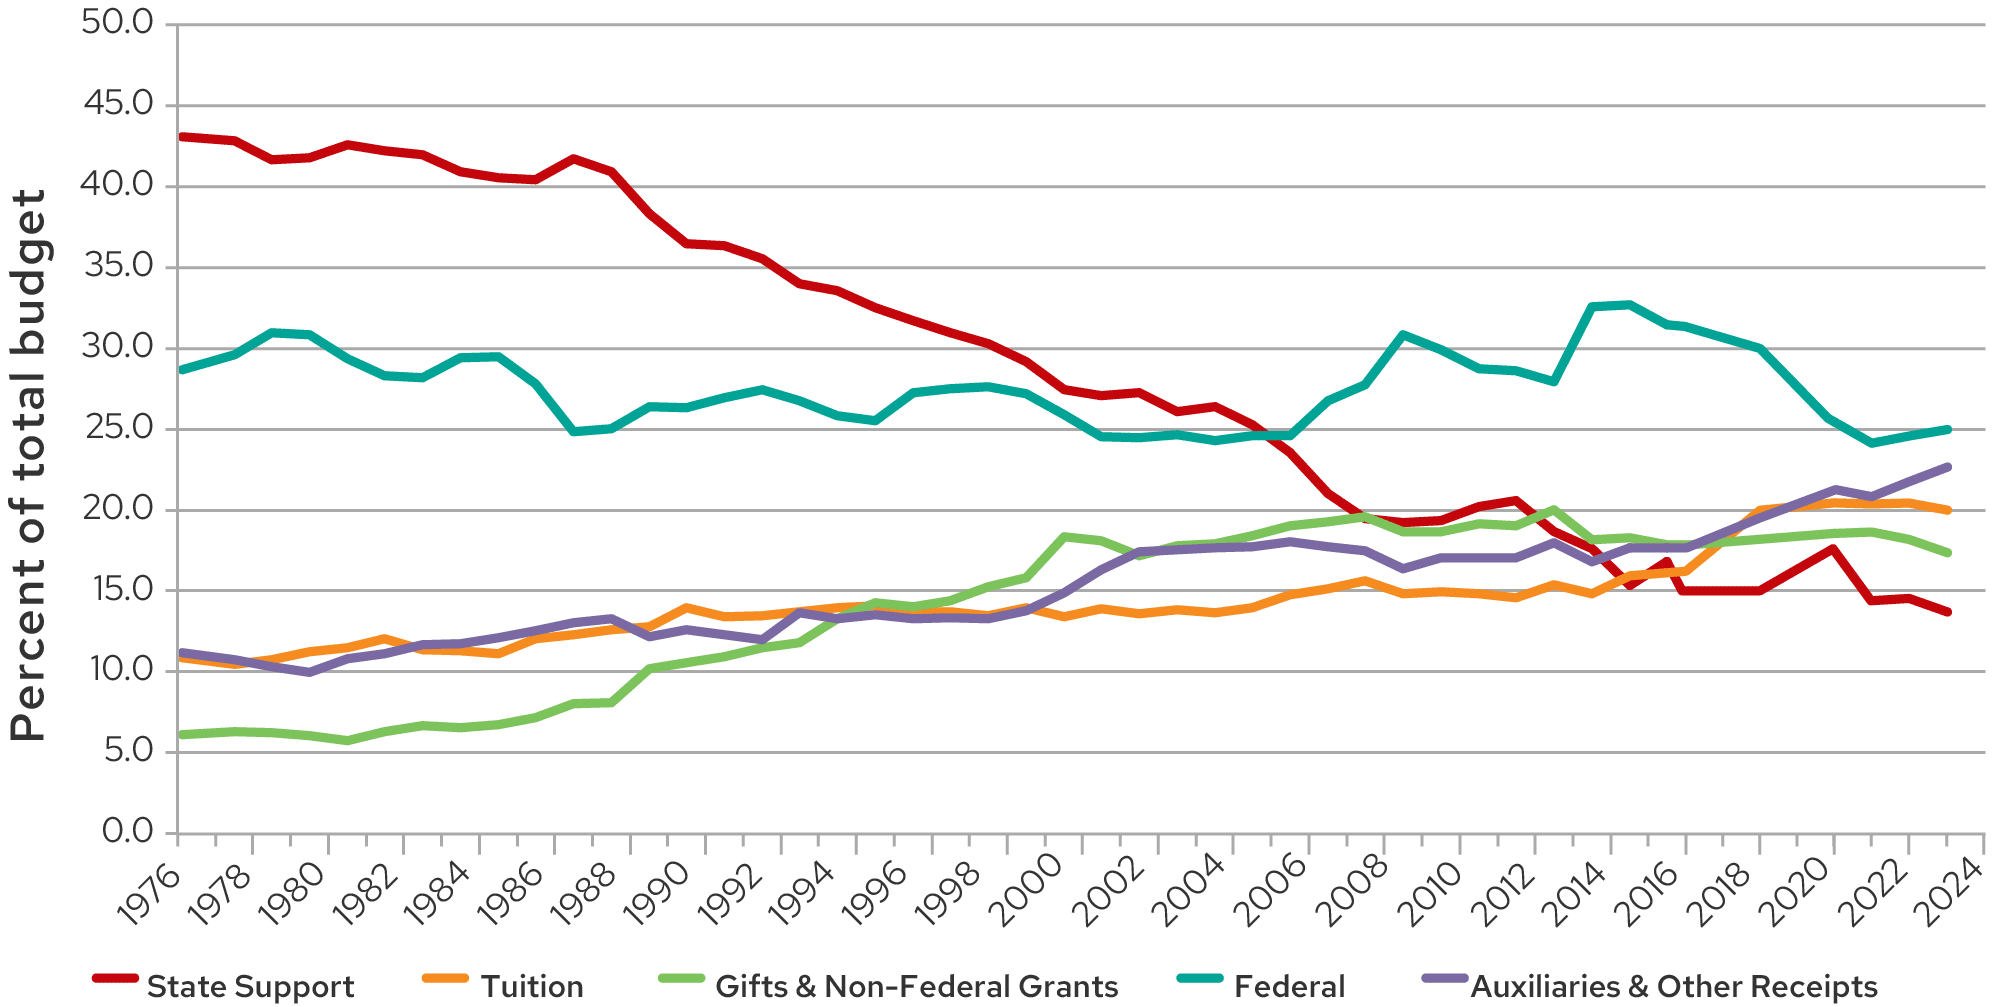
UW–Madison’s funding sources have shifted over the decades. As the chart below indicates, the amount of support the university receives in state funds relative to its overall budget has declined, and the university has become increasingly reliant on private donations, federal dollars, research grants, and tuition payments.
In 1974, the year the UW System was created, state revenue accounted for 43 percent of UW–Madison’s total revenue. This has declined to 14 percent of the university’s total revenue in 2023. State support in inflation-adjusted dollars in 1974 was approximately $644 million. Since that time, it has declined by approximately $93 million in inflation-adjusted dollars.
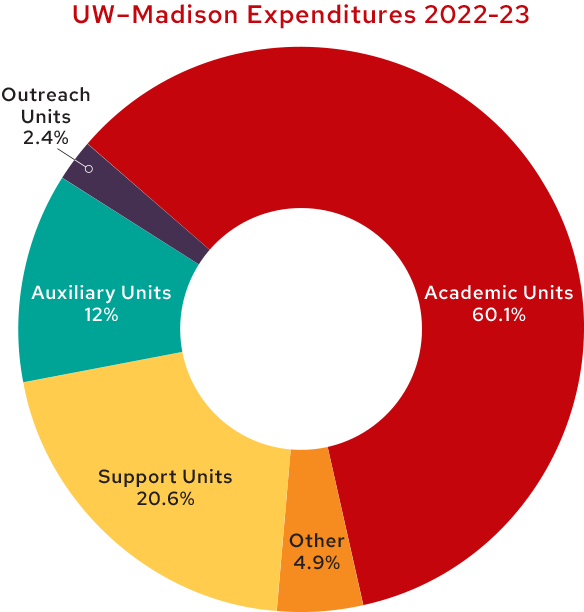
UW–Madison Expenditures
Expenditures at UW–Madison reflect the core missions of education, research, and outreach. More than $2.5 billion, 60.1% of total expenditures, is allocated to our academic units. In addition, 20.6% is spent on student financial aid and support units necessary to the academic and research missions of the university, such as the library system and information technology, and 12% is spent on auxiliary units, such as Housing, that serve the entire university and generate much of their own revenue.
Access
![]()
- 9,692 Wisconsin residents applied for fall 2023, and 61% were admitted.
- The 2023 freshman class of 7,966 students includes the second-highest number ever of Wisconsin residents at 3,813, once again higher than the 3,600 Wisconsin resident students UW–Madison has committed to enrolling in each fall freshman class.
Affordability
![]()
- For 2022–23, more than 65% of bachelor’s degree recipients had no student loan debt, the highest debt-free percentage in the last 10 years. Of those that had debt, the average was $25,589, the lowest amount in the last 10 years.
- In 2023, 16% of Wisconsin resident undergraduate students were covered by either Bucky’s Tuition Promise (which ensures full coverage of tuition and fees for students with family incomes under $65K) or Bucky’s Pell Pathway (which ensures coverage of the full cost of attendance for students who qualify for the Federal Pell Grant). These programs are funded with institutional dollars and private gifts at no cost to taxpayers.
Building Wisconsin’s Workforce
![]()
- Time to graduation continues to fall. Undergraduates now complete their degrees in an average of 3.84 calendar years, down from 4.14 10 years ago.
- At the 10-year mark, 47% of bachelor’s degree alumni have a Wisconsin address.
Commitment to Wisconsin
UW–Madison’s commitment to Wisconsin creates a powerful partnership to grow the state economy by using funding from the state budget to educate and prepare students to become the next generation of highly skilled employees needed by Wisconsin businesses.